pQCT Density Distribution
This plugin is designed to perform the following pQCT analyses:
- Conventional bone analyses (e.g. cortical area and volumetric bone mineral density)
- Regional bone mineral density calculations (density distribution1)
- Bone marrow analysis for a tubular bone2
- Conventional soft tissue analyses (e.g. subcutaneous fat cross-sectional area, muscle cross-sectional area)2
1Rantalainen T, Nikander R, Heinonen A, Daly RM, Sievanen H. An open source approach for regional cortical bone mineral density analysis.
J. Musculoskelet. Neuronal Interact. 2011 Sep;11(3):243-8.
2 Rantalainen T, Nikander R, Heinonen A, Cervinka T, Sievanen H, Daly RM. Differential Effects of Exercise on Tibial shaft Marrow Density in Young Female Athletes. J. Clin. Endocrinol. Metab., in press.
If you use this program, or the Stratec pQCT file format reader in your work, please cite the pertinent papers. Contact Timo Rantalainen for further details on the functionality of this plugin, to request features or report bugs.
Density Distribution is not included in BoneJ2. To install it, turn on the PQCT update site in the ImageJ2/Fiji updater. Up-to-date documentation is provided at imagej.net. The instructions below relate to BoneJ1 and are retained here for archival purposes.
How to use the Density Distribution analysis:
- Open tibial mid-shaft image file: File -> import -> Stratec pQCT (the analysis works also on DICOM files).
- Run the distribution analysis Distribution: Plugins -> pQCT -> Distribution Analysis
- A window pops up with selections. Many of the default selections probably work for you, but remember to select at least one analysis!
- Make sure that the scaling coefficient, constant and in-plane pixel size are correct!
- Area and BMD thresholds may need adjustments (e.g. somewhere between 169 to 280 mg/cm3 is routinely used for distal bone sites. Similar adjustments are needed for bones with narrow cortices, such as in children or in the elderly).

- Flipping image prior to analysis, preventing filtering and removing measurement tube from soft tissue analysis
- Flip horizontal Used to flip the image vertically [sic] (Stratec produces the image rotated by 90 deg from what one might have expected).
- Flip vertical Used to flip the image horizontally [sic] (Stratec produces the image rotated by 90 deg from what one might have expected).
- No filtering Used to prevent 3x3 median filtering of bone analyses and 7x7 filtering of soft tissue analyses.
- Measurement tube Used to remove the measurement tube used for lower limb measurements with some versions of the XCT3000 measurement device
from soft tissue analyses.
- Thresholds, ROI-selections and results alignment
- Air threshold Used to separate the whole limb from the background (used in soft tissue analyses to create a limb template or
if Roi selection is Central or peripheral. In soft tissue analysis limb includes >= air threshold.).
- Fat threshold Used to create a fat template within the limb area (used in soft tissue analyses, i.e.
fat includes >=air threshold to <fat threshold not within the muscle template).
- Muscle threshold Used to create a muscle template for soft tissue analysis (All areas within the limb template traced with density >= muscle threshold contributing
> 1% in addition to the muscle areas already added starting from largest. Thus muscle template area may include pixels with lower density).
- Marrow threshold Used to separate marrow from bone (<= marrow threshold within bone area is assigned to marrow).
- Soft tissue threshold Used to remove bones from the muscle template (All areas traced with density >= soft tissue threshold
(i.e. bones) will be subtracted from the muscle (and fat) templates).
- Area threshold Used to separate bone from everything else. Theshold used for total area (ToA) and bmd (ToD) as well as for cortical area (CoA) and SSI and BSId calculations.
- BMD threshold Used to separate cortical bone from everything else. Theshold used for density distribution and cortical density (CoD) analyses.
- Scaling coefficient Used as the coefficient to scale the raw integer values read from the image file into BMD values
, i.e. b in y = a+bx, where b is the raw value (N.B. in case of Stratec files a value of 2^15 is subtracted prior to applying
the scaling to account for the fact that the values were stored as 16 bit signed integers
, while ImageJ uses 16 bit unsigned integers. Also, the scaling is retrieved from a list of Stratec .TYP-files according to the image header information.
In case of DICOM-files, the DICOM scaling (typically y = -1000+1x) is applied prior to applying this scaling.).
- Scaling constant Used as the constant in scaling the raw integer values read from the image file into BMD values, i.e. a in y = a+bx.
- Roi selection Used to define, which bone is to be analysed. Results are always produced for one bone at a time.
- Soft Tissue Roi selection Used to define, which soft tissue area is analysed (in case of the image containing more than one.
Results are always produced for one soft tissue area at a time.
- Rotation selection Used to define, how the mass distribution, concentric density distribution and density distribution results are aligned.
- Analysis selections
- Analyse cortical results Whether (ticked) or not to analyse ToA, ToD, SSI, CoA, CoD and BSId.
- Analyse mass distribution Whether (ticked) or not to analyse mass distribution.
- Analyse concentric density distribution Whether (ticked) or not to analyse concerntric density distribution. Useful for e.g. distal bone without medullary cavity.
Analyses density distribution in 10 anatomical concentric rings starting from the centre of the bone area.
- Analyse density distribution Whether (ticked) or not to analyse density distribution. N.B. will not produce meaningful results for bones without medullary cavity.
- Analyse soft tissues Whether (ticked) or not to analyse soft tissues.
- Prevent peeling PVE pixels Whether (ticked) or not to prevent peeling outermost and innermost layer of pixels in density distribution analysis.
Useful e.g. for enabling analysis in subjects with thin cortices. N.B. having included PVE pixels should be kept in mind while interpreting the results !
- Allow cleaving Used to separate bones/soft tissue areas, which are connected with a narrow struct*.
- Suppress result image The analysis pops up a result image, which may be suppressed by ticking this box. Useful e.g. for batch processing.
- Limit ROI search to manually selected If ticked, only manually delineated ROI will be searched for a bone, and for soft tissues (The ROI selected with ImageJ ROI tools prior to executing the Distribution Analysis is used).
- Set distribution results rotation manually If ticked, the density distribution results will be rotated according to the value given in the text box below.
- Manual rotation If the tick box above is ticked, the density distribution results will be rotated according to the value given in the text (useful, e.g. when the automatic rotation fails).
- Distribution analysis flipping and results visualization
- Guess flip If ticked, will allow trying to guess whether results need to be flipped.
- Guess right If ticked, will try to guess whether results need to be flipped. If selected bone is closer to image left/upper border (Stacked not ticked or ticked, respectively), the results are not flipped.
- Guess larger If ticked, will try to guess whether results need to be flipped. If larger bone is closer to image left/upper border (Stacked not ticked or ticked, respectively), the results are not flipped.
- Stacked bones Used only if guess right or guess larger is ticked. Stacked means that the bones are expected to be on top of each other in the image (e.g. tibial mid-shaft in Stratec images).
- Guess stacked Used only if guess right or guess larger is ticked. Tries to guess whether the bones are stacked. The default guess is not, but if the
y-axis distance of the centres of the two largest bones differs by more than 1.1 time the x-axis distance, the bones are considered stacked.
- Invert flip guess If ticked will invert the flip guess made by guess right or guess larger. Useful for e.g. analysing two bones from the same image in
order to align the distribution results similarly.
- Flip distribution results If ticked, the distribution results will be flipped to a mirror image. Useful for e.g. comparing left to right leg.
- Save visual result image on disk If ticked, will save visual result image on disk into the path given in the text box below. Useful e.g. for batch processing, allowing visual inspection of the results after running the batch.
- Image save path If the above check box is ticked, the path given in this text box is used as the path into which the visual result images are saved to, i.e. c:/path/to/save/to/. remember to add the trailing /. Either / or \ may be used in the path.
- Hit OK and the analysis should run...
How are the density distribution results aligned?
- Endo- and pericortical radii, and endo-, mid- and pericortical densities are produced for 36 10 degree sectors by the analysis plugin.
- The sector from 0 - 10 deg opens always directly to right in the visual result image.
- Sectors increase into clockwise direction in the visual results image, or counter clockwise, if results are flipped.
- If you have selected flip distribution results, the sectors are still the same, but you will notice that the visual distribution result has been mirrored about the horizontal axis. This flipping is implemented by reversing the distribution results vectors and by making sure that the 0 - 10 deg sector remains the same.
- The color of the line used to delineate the endo- and pericortical border indicates in which direction the sector angle increases. 0 angle is blue and 360 is green/red.
- In addition, the original and rotated x- and y- axes are highlighted in the visual image (the origin of which is the origin of the distribution results). The axes extend from origin towards positive coordinate values, green/cyan x-axis and blue/purple y-axis.
What do the result headings mean?
- Alpha [deg] = how many degrees were the results rotated
- Rotation correction [deg] = correction for centering sector 0
- Distance between bones[mm] = distance between the centre of bone areas for two bones
- MuD [mg/cm³] = muscle density (including possible intramuscular fat)
- MuA [cm²] = muscle area (including possible intramuscular fat)
- LeanMuD [mg/cm³] = muscle density (excluding possible intramuscular fat)
- LeanMuA [cm²] = muscle area (excluding possible intramuscular fat)
- IntraFatD [mg/cm³] = intramuscular fat density
- IntraFatA [cm²] = intramuscular fat area
- FatD [mg/cm³] = total fat density (both intra and subcut)
- FatA [cm²] = total fat area (both intra and subcut)
- SubCutFatD [mg/cm³] = subcutaneous fat density
- SubCutFatA [cm²] = subcutaneous fat area
- LimbD [mg/cm³] = limb density (including bones)
- LimbA [cm²] = limb area (including bones)
- Density weighted fat percentage [%]
- MaMassD [g/cm³] = marrow mass density converted from hydroxyapatite equivalent densities (HA). Works for CT, where water is given a HA value of zero
- StratecMaMassD [g/cm³] = marrow mass density converted from hydroxyapatite equivalent densities (HA) to mass density. Works for Stratec pQCT, where fat is given a HA value of 0
- MaD [mg/cm³] = marrow density
- MaA [mm²] = area included into the marrow analysis (N.B. != MeA)
- CoD [mg/cm³] = cortical density
- CoA [mm²] = cortical area
- Stratec CoD [mg/cm³] = cortical density (pixels need not be continguous as in the analyses conducted by Stratex software. However, if pixels aren't continguous, incorrect ROI is typically defined automatically by the plug-in and the analysis will fail)
- Stratec CoA [mm²] = cortical area (pixels need not be continguous as in the analyses conducted by Stratex software. However, if pixels aren't continguous, incorrect ROI is typically defined automatically by the plug-in and the analysis will fail)
- SSI [mm³] = Strength strain index (= density weighted section modulus)
- SSImax [mm³] = Maximal strength strain index
- SSImin [mm³] = Minimal strength strain index
- IPo [mm4] = Polar second moment of area (=polar cross-sectional moment of inertia)
- Imax [mm4] = Maximal second moment of area (=maximal cross-sectional moment of inertia)
- Imin [mm4] = minimal second moment of area (=minimal cross-sectional moment of inertia
- dwIPo [mg/cm] = density weighted polar second moment of area (=polar cross-sectional moment of inertia)
- dwImax [mg/cm] = density weighted maximal second moment of area (=maximal cross-sectional moment of inertia)
- dwImin [mg/cm] = density weighted minimal second moment of area (=minimal cross-sectional moment of inertia
- ToD [mg/cm³] = total density
- ToA[mm²] = total area
- MeA [mm²] = non-cortical area (= ToA - CoA)
- BSId[g²/cm4] = compressive strength index (=ToD^2*ToA)
How to interpret the distribution results
Polar distribution

The mean of the three radial divisions within a given sector is reported as the density of that sector.
applies to:
- 0° - 10° ... 350° - 360° mineral mass [mg]
- Polar sector 0 ... 35 vBMD [mg/cm³]
Radial distribution
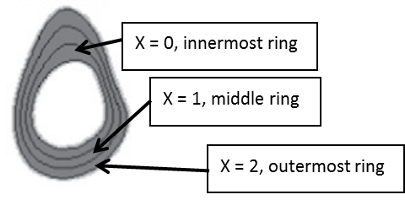
The mean of the thirty six 10 degree sector within a given anatomical ring is reported as the density of that ring.
applies to:
- Radial division 0 ... 2 vBMD [mg/cm³]
Polar and radial distribution
- Division X sector 0° - 10° ... 350° - 360° vBMD [mg/cm³]
- 0° - 10° ... 350° - 360° endo/mid/pericortical vBMD [mg/cm³]
Are a combination of the above.
Radii distribution
- 0° - 10° ... 350° - 360° concentric analysis pericortical radius [mm]
- 0° - 10° ... 350° - 360° endo/pericortical radius [mm]

Endo- and pericortical radii are given as the distance from the centroid of the marrow cavity to the endo- and pericortical border, respectively. The radii are calculated prior to peeling off the layers of pixels from endosteal and periosteal border.
Batch processing sample
- Synthetic data, which may be used for testing, whether the analysis tool gives expected results. The source to produce the synthetic data and the expected results are also included.
- An ImageJ macro to batch process the synthetic data.
- Open the SyntheticDataTest.ijm with your favourite text editor (e.g. notepad++, right click -> open with in windows)
- Change the paths on line 2 and 3 to ones that match your computer, i.e.:
line 2: sourceDir = "C:/Oma/Deakin/METODOLOGIA2010/Julkaisu/webStart/SyntheticData/"; Replace everything between the "" with your path, C:/your/path/to/synthetic/images/. Remeber the trailing /
line 3: visualDir = "C:/Oma/Deakin/METODOLOGIA2010/Julkaisu/webStart/sCheckImageJ/"; Replace everything between the "" with your pathC:/your/path/to/visual/results/. Remeber the trailing /
N.B. The paths need to exist prior to executing the macro. In addition, windows operating system does not seem to work if the path contains spaces.
If you are working with windows and do have spaces in your path, replace the / with \\.
- Remember to save your macro (perhaps with a new name)
- Once you have corrected the paths to your macro file, run the macro with ImageJ: Plugins -> Macros -> Run -> browse to your saved macro and click open. Wait for the macro to run ...
- Once the macro is finished, you should be left with a Results window, which you may save File -> Save As.
- Open the resulting file with excel or open office or some other suitable program and the results should match the ones within the Synthetic data provided above. N.B. the result file in the Synthetic data .zip is from the sofware provided with the original publication that the plugin is a spin-off from. In that software, the results were always flipped and consequently, in the macro above, the results are flipped (line 7 remove flip_distribution_results to not flip the results). The flipping behaviour was changed from the previoius software to the BoneJ plugin to make the results conform with the visual results (which is perhaps more intuitive).
N.B. the plug-in works with setBatchMode(true), but does not work with command line execution using the -batch option (or at least it didn't work when I tried to save the results window from command line executed macro with saveAs("Results", savePath+saveFileName), whereas the same macro run from command line with -macro worked as expected).
Acknowledgements
Footnote
*Cleaving is made by looking at the ratios of distances between two points along the edge and the shortest distance between the points. If the maximum of the ratio is high enough (3 was arbitrarily selected), the highest ratio points will be connected with a straigth line and one of the resulting edges will be discarded. E.g. for a circle, the maximum ratio is (pi/2)/d ~= 1.57 and for square the maximum ratio is 2/sqrt(2) = sqrt(2) ~= 1.41.

 This file last modified 1345hrs 29 May 2020 © Michael Doube 2004-2026 :: Designed to be interoperable and standards-compliant.
